UK public debt dipped in July from a record. Will August's figure set a new one?
Public sector net debt fell to £2,984.9 billion at the end of July, £15.1 billion short of £3 trillion. The August figure comes out on 22 September.
What happened
Public sector net debt excluding public sector banks was provisionally £2,984.9bn at the end of , 94.1% of GDP, after July borrowing of £1.8bn came in £2.3bn above the OBR forecast; June’s £2,994.8bn was the highest reading in the series.
The August figure comes out at 7am on . Two lines sit above July’s level: June’s record of £2,994.8 billion, £9.9 billion away, and £3 trillion, £15.1 billion away. The Budget follows five weeks later, on Wednesday , a date confirmed by the Chancellor, John Healey.
Public debt in July was £95.9 billion higher than a year earlier. As a share of the whole economy, called GDP, it was 0.8 percentage points lower than in . July is the month when people who file their own tax returns pay income tax. These receipts were £17.1 billion, £1.7 billion more than a year earlier.
The government still borrows more than it takes in. It borrowed £1.8 billion in July. That is £0.7 billion more than in and £2.3 billion more than the Office for Budget Responsibility (OBR), the official forecaster, expected in March. From April to July it borrowed £56.7 billion, £6.0 billion less than a year earlier but again £2.3 billion above the forecast.
Leaving out investment, the government took in £3.1 billion more than it spent in July. So debt dipped on one strong tax month while borrowing went on. That is the situation the history below looks at.
Sources: ONS (2, 3), HM Treasury
The Pattern
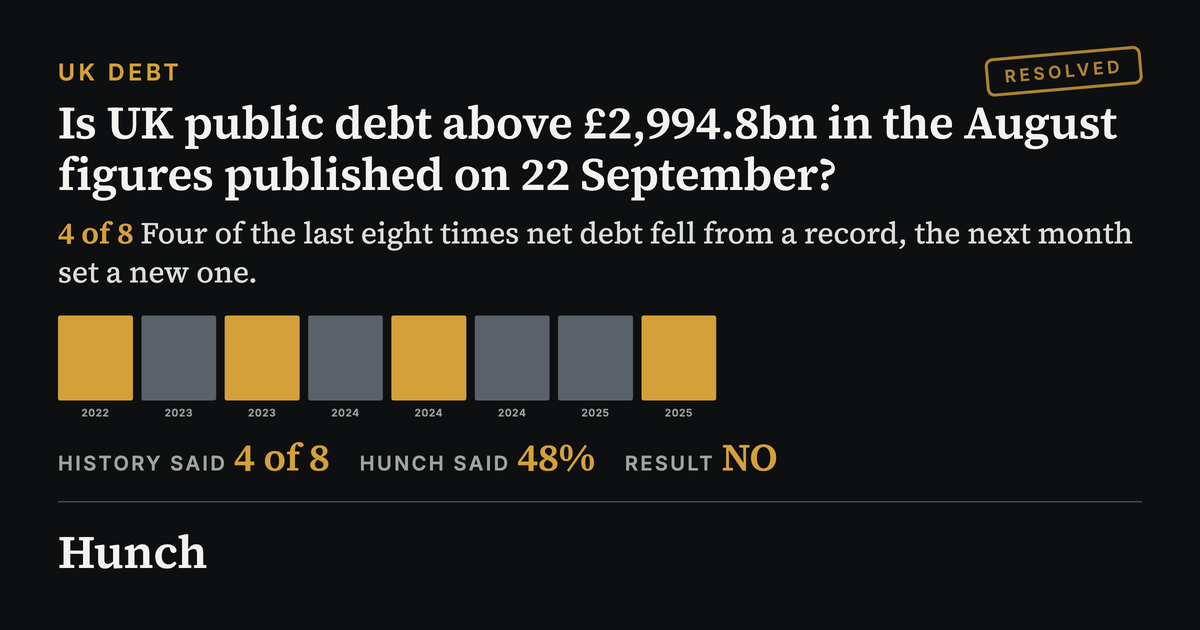
UK public debt has fallen from a record 62 times since 1993. We used the official monthly ONS figures and took every month when debt fell from its highest level so far, as it did this July. Then we checked whether the next month set a new record. It did in 22 of the 62, and in four of the last eight. The eight most recent are shown below.
Show the other 6 cases
The Read
History gives no clear lean. Four of the last eight dips from a record were followed by a new record the next month, and four were not. Over the whole period since 1993 it happened about one time in three. Most dips come in July and January, when self-assessment tax arrives, and the month after gets no such boost. That is why our estimate opens a little below even.
August borrowing has run into double figures, in billions of pounds, in each of the last four years, and that points to a new record. July’s strong tax receipts of £17.1 billion point the other way. So does the timing of cash payments, which can keep debt lower for a while than borrowing suggests.
The £3 trillion line is a separate question. Passing June’s record needs a rise of £9.9 billion, and passing £3 trillion needs £15.1 billion. Four of the last ten Augusts raised debt by that much, including the last three. A figure above the record but below £3 trillion is the most likely result, which is why our £3 trillion estimate is lower. It is also the last debt figure the OBR sees before it finishes its forecast for the Budget, which the Chancellor says will be built on fiscal discipline, meaning tight control of borrowing.
Disclaimer
Hunch works only from sources that are publicly available, and publishes on the basis of analysis of that material. We do not form an editorial opinion or take sides, we give a simpler and wider view of news that already exists. If information in a source we used was inaccurate, distorted, or later disputed but had already entered our analysis, Hunch accepts no liability for that. Predictions are not advice. Phase 1 markets use Hunch Points, not money.
Published by Hunch under the Editorial Code. Complaints and corrections: /contact/.