UK borrowing costs are the highest in years. Past highs mostly eased two months on.
The UK government has £121.4 billion of bonds to sell in 2026-27. Its 10-year borrowing cost averaged 5.07% in August, its highest since June 2008.
What happened
Gilt sales in 2026-27 reached £124.8bn by against total planned sales of £246.2bn, leaving £121.4bn required with 28 auctions remaining; long conventional sales stand at £4.35bn of a £22.77bn plan after the first of three long syndications.
The UK government borrows by selling bonds, called gilts, through its Debt Management Office (DMO). Most of this year’s sales so far are short-term and medium-term gilts, £55.8 billion and £49.2 billion. Sales of gilts linked to inflation stand at £15.5 billion.
On the DMO moved £3.8 billion of medium-term and £1.25 billion of inflation-linked sales into its syndications. In a syndication, a group of banks sells a new gilt to investors in one go.
Long-term gilts are the weak spot. Of the long-term money raised so far, £3.98 billion came from the first of three planned syndications and £368 million from a July tender. No long-term auction has been held yet, and four are still planned. Demand for long-term gilts has been weak since 2022, and the plan already leans on shorter ones.
August’s 5.07 per cent was the highest since . That is the Bank of England’s monthly average interest rate on ten-year gilts. It was 5.03 in May and 5.01 in July. The Chancellor, John Healey, presents his first Budget on Wednesday . A new forecast from the OBR, the official budget watchdog, and a new DMO plan come out the same day.
Sources: DMO, Bank of England series IUMAMNZC, HM Treasury
The Pattern
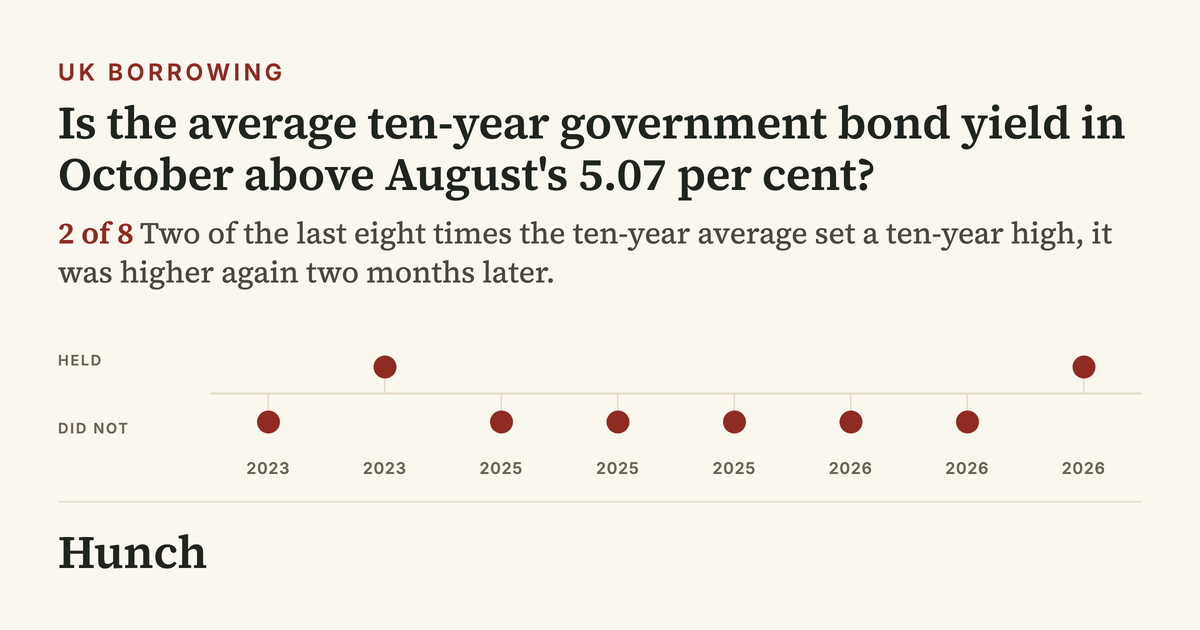
Two of the last eight highs rose further two months later. We used the Bank of England’s monthly average for ten-year gilts since 1990. We took every month when the average was the highest for ten years, as in , and asked whether it was higher still two months later. All twelve such months came after , because rates fell for most of the three decades before. We show the last eight and count all twelve.
Show the other 6 cases
The Read
History points to a pause. After two of the last eight highs, the average was higher two months later. Across all twelve since 2022 it was four. The 2026 highs came in a cluster, in March, April, May and now August. March led to a higher May, but April and May were each followed by a lower average two months on. That is why the market opens well below even chances.
History cannot see the calendar. The DMO still has £121 billion to sell in seven months, and long-term sales have raised £4.35 billion of a £22.77 billion plan. The Budget falls inside the window, with a new borrowing plan attached. Two past cases also tested the month of October, and , and the rate rose further only in 2023.
If the October average goes above 5.07 per cent, the heavy bond sales and the Budget numbers will be the reason. If it does not, the usual pattern will have repeated.
Disclaimer
Hunch works only from sources that are publicly available, and publishes on the basis of analysis of that material. We do not form an editorial opinion or take sides, we give a simpler and wider view of news that already exists. If information in a source we used was inaccurate, distorted, or later disputed but had already entered our analysis, Hunch accepts no liability for that. Predictions are not advice. Phase 1 markets use Hunch Points, not money.
Published by Hunch under the Editorial Code. Complaints and corrections: /contact/.