Will Singapore's export boom stay above 50% growth in November?
Singapore's key exports grew 79.8% in October from a year earlier. The US tightened chip rules a day earlier. November's figure is due on 17 December.
What happened
Singapore’s non-oil domestic exports grew 79.8% in October from a year earlier, after 68.3% in September.
Singapore’s non-oil domestic exports (NODX) grew 79.8% in October from a year earlier, after 68.3% in September, Enterprise Singapore said on . This figure counts goods made in Singapore, without oil and without goods that only pass through. Ship exports rose by S$4.8bn, and the agency says this is because was weak for ships.
Electronics grew 73.9% in October, down from 107.6% in September. The agency links the rise to demand for artificial intelligence. Exports to the US grew 214.6%, led by medicines, and to China 144.9%. Over the first ten months of 2026, growth was 33.6%.
On the US government began to require a licence to send advanced chips to Singapore and four other countries, saying they carry a higher-than-normal risk of chips going on to China. Prime Minister Lawrence Wong said most chips only pass through Singapore and “I think we can manage that impact”. Goods that pass through are counted as re-exports, outside this figure.
The November figure comes out on , by the statistics office calendar. Exports in were S$16.70bn, below at S$17.04bn. So can fall up to 18.3% from October’s S$30.64bn and still show growth above 50%.
Merchandise Trade, Nov 2026
SingStat advance release calendar, 17 December 2026
Sources: CNA (2, 3), SingStat, SingStat
The Pattern
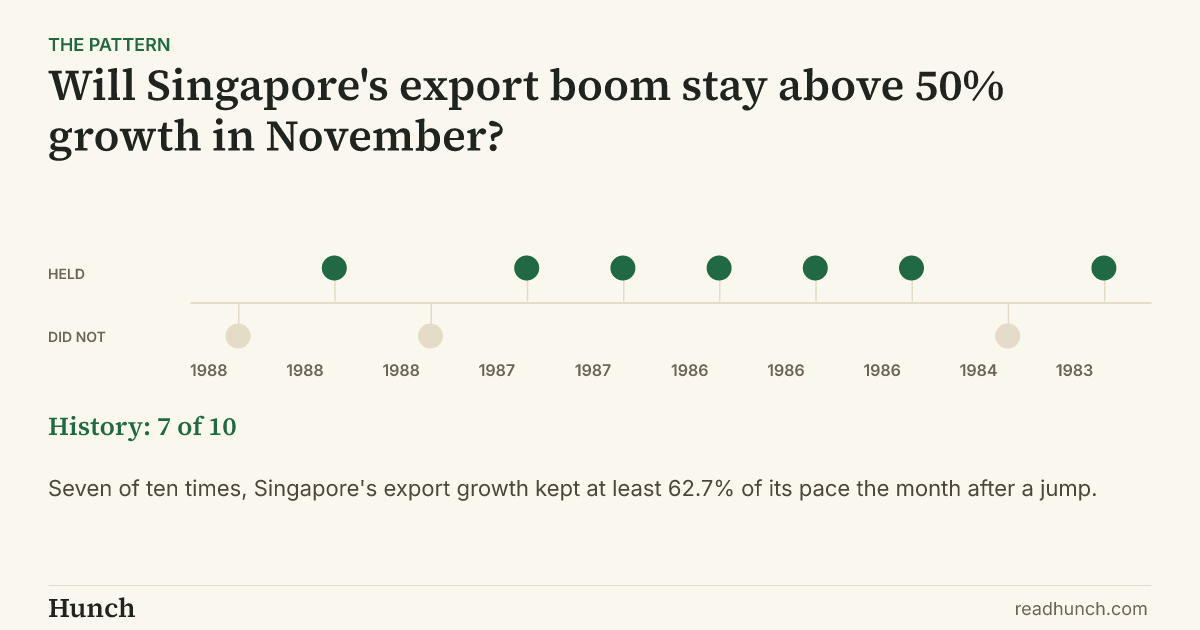
We looked for cases where Singapore’s non-oil domestic exports grew 30% or more from a year earlier for at least a second month running, faster than the month before. We found ten such months from 1983 to 1988, in four runs of fast growth. None started as high as 79.8%; the highest was 63.8%.
Show the other 8 cases
The Read
Six of the ten next months were slower than the jump month, and five fell by 13.5 points or more. After each of the four jump months above 50%, the next month was lower. Only one next month stayed at 50% or more, but every jump month then started lower than today’s 79.8%, so a fall of the same size would leave Singapore above 50% seven times in ten.
There are reasons for doubt. All ten months come from Singapore from 1983 to 1988, in years of strong demand, while this year’s jump leans partly on a weak for ships. Without the S$4.8bn ship rise, the same level as October in November would give growth of about 55%. The new US chip rules mostly hit goods passing through Singapore, which this figure leaves out.
Disclaimer
Hunch works only from sources that are publicly available, and publishes on the basis of analysis of that material. We do not form an editorial opinion or take sides, we give a simpler and wider view of news that already exists. If information in a source we used was inaccurate, distorted, or later disputed but had already entered our analysis, Hunch accepts no liability for that. Predictions are not advice. Phase 1 markets use Hunch Points, not money.
Published by Hunch under the Editorial Code. Complaints and corrections: /contact/.