Ministers put £9.58bn into 73,600 homes. Can social rent pass 13,000 a year again?
The first wave of the £39 billion Social and Affordable Homes Programme gives £9.58 billion for around 73,600 homes across England outside London.
What happened
The Prime Minister and the Secretary of State announce the first wave of the £39 billion Social and Affordable Homes Programme, allocating £9.58 billion for around 73,600 homes across England outside London.
The money is the first wave of a ten-year programme. More than £2 billion of it is expected to be spent in areas with a mayor. At least £6 billion more is offered in London through the Greater London Authority. Councils also get £46 million over three years to build up their ability to do the work.
Nearly two thirds of the homes are expected to be for social rent, the lowest-cost rented homes. More than £16 billion of the £39 billion is still not allocated outside London.
The split names the mayoral areas directly. Greater Manchester gets £529 million for around 4,400 homes, the North East £445 million for around 3,400, and West Yorkshire £441 million for around 4,000. The West Midlands gets £409 million for around 3,200, Liverpool City Region £380 million for around 3,100 and South Yorkshire £249 million for around 2,200.
These are the same areas that were given planning call-in powers on , which let them take over decisions on large developments. That means more than 150 homes, 15,000 square metres of commercial space or a height of 30 metres.
The announcement sets no rate for building, and money allocated is not the same as homes finished. England publishes the number of finished homes every year. The latest tables, revised on , show 64,921 affordable homes finished in 2024-25, of which 12,267 were for social rent.
The figure for 2025-26 is due in the autumn. The figure for 2024-25 came out on .
The Pattern
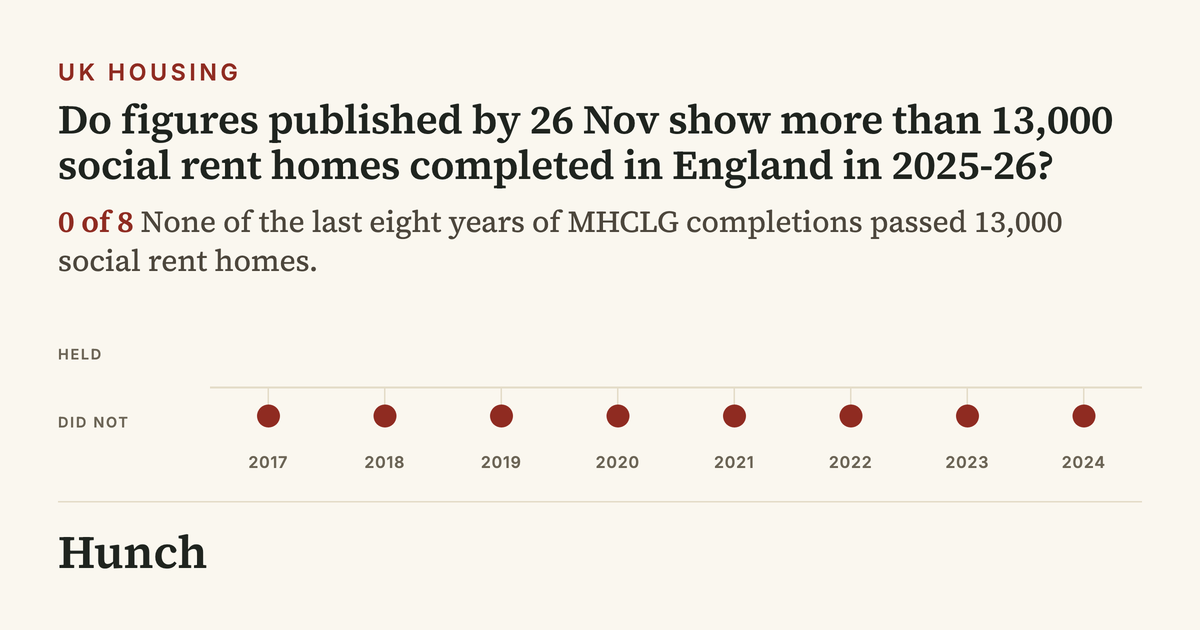
We looked at the government’s yearly count of homes for social rent finished in England. The count has been made the same way since 1991-92. Our record starts in 2012-13, the first full year after ‘affordable rent’ replaced social rent as the main type of home the state paid for, and runs to 2024-25. For each year we asked whether more than 13,000 social rent homes were finished. Only the first year, 2012-13, passed that mark. The eight most recent years are shown.
Show the other 6 cases
The Read
History says no. None of the last eight years passed 13,000 social rent homes. But the number has risen four years running, by 1,942 homes between 2023-24 and 2024-25. Reaching 13,000 in 2025-26 needs a rise of only 733, well inside the recent range. That is why the market sits a little above evens, even though the record is against it.
The weak spot is timing. The new money cannot show up in the 2025-26 figures at all, because homes finished that year were paid for years ago. So these markets measure the homes the programme inherits. The total is harder to move: it changed by 4,758, then 557, then 575 homes in the last three years, and 68,000 would need a jump bigger than any of them.
The figures due by will settle the markets on homes finished. The market on new allocations by is low because the first wave was designed as the big announcement. More than £16 billion is still unallocated, but a department that has just given out £9.58 billion in one release has no reason to follow it with another within a month. The money for councils also runs over three years, not three weeks.
Disclaimer
Hunch works only from sources that are publicly available, and publishes on the basis of analysis of that material. We do not form an editorial opinion or take sides, we give a simpler and wider view of news that already exists. If information in a source we used was inaccurate, distorted, or later disputed but had already entered our analysis, Hunch accepts no liability for that. Predictions are not advice. Phase 1 markets use Hunch Points, not money.
Published by Hunch under the Editorial Code. Complaints and corrections: /contact/.