Northern Ireland unemployment is 1.96%. Such lows usually lasted a month.
The latest Labour Force Survey puts Northern Ireland unemployment at 1.96 per cent. 40.7 per cent of adults are neither working nor looking for work.
What happened
NISRA’s Labour Market Report puts Northern Ireland unemployment at 1.96% for April to , with economic inactivity at 40.7% and 628,000 people economically inactive.
NISRA, the Northern Ireland statistics agency, counted 18,000 people unemployed in April to and 898,000 in work. The employment rate was 58.2 per cent. Unemployment is down 4,000 on a year earlier.
Economic inactivity is up 10,000 on the year. These are people aged 16 and over who are neither working nor looking for work.
The two moves are linked. Someone who stops looking for work leaves the unemployment count and joins the inactive count. That lowers one figure and raises the other at the same time. The record high for inactivity is 42.4 per cent, in March to , which is 1.7 points above where it stands now.
The next reading comes on . It will cover May to July, which shares two of its three months with the current quarter. NISRA’s Labour Market Report that day also brings the claimant count, redundancies and HMRC payroll figures. The two reports after that come on and .
The Pattern
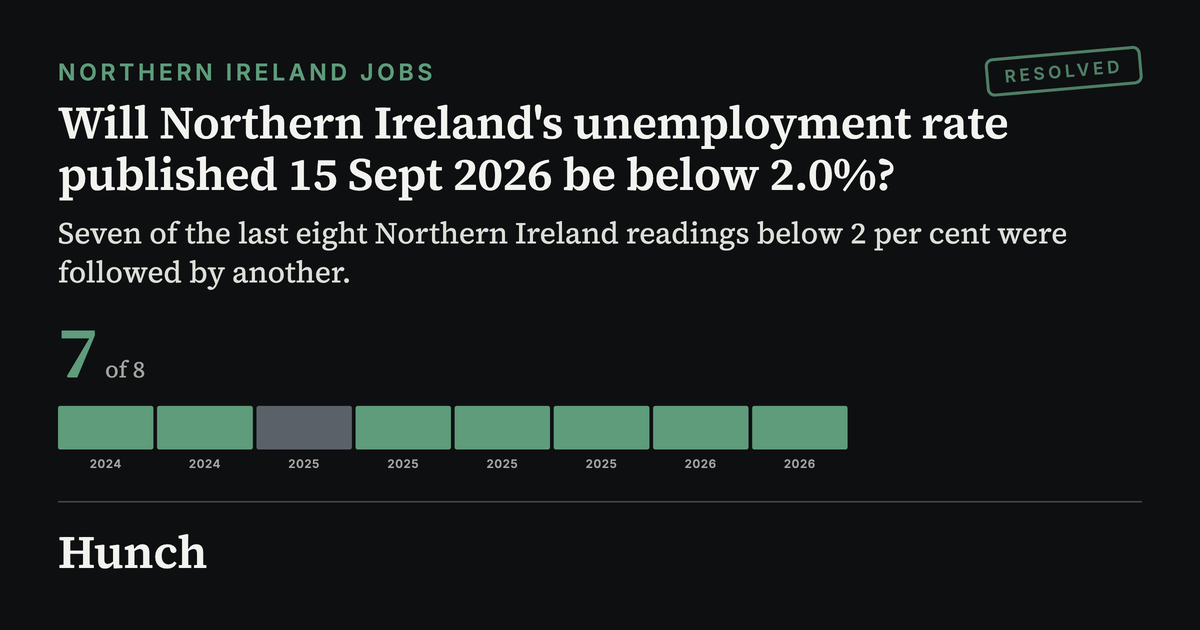
We looked at NISRA’s whole unemployment series, from early 1995 to : 376 readings in all. Only 17 are below 2 per cent, all of them since 2023, and 16 of those have a reading after them. For each we asked whether the next reading was also below 2 per cent. Seven of the last eight were followed by another below 2 per cent. The last eight are shown.
Show the other 6 cases
The Read
History points to another reading under 2 per cent. Each reading shares two of its three months with the one before, so a rate of 1.96 per cent does not jump to 2.3 per cent in a month unless something breaks. The published record says a reading under 2 per cent is usually followed by another, 14 times out of 16 in all.
There are two weak spots. The readings overlap so much that the whole record really comes from two spells below 2 per cent. And the direction is up: the last three readings went from 1.78 to 1.85 to 1.96, and one more step that size crosses the line. That is how the February to exception happened.
The inactivity market sits low for a reason. The rate has not been above 41 per cent at any point in the last year, though it came within a twentieth of a point in December to February, and it usually moves by a tenth or two. Read together, the two figures show a job market where few people are counted as unemployed and more stop counting as part of it at all. That is the number the Executive’s economy department has to move, and no monthly release has moved it yet. The release settles both markets.
Disclaimer
Hunch works only from sources that are publicly available, and publishes on the basis of analysis of that material. We do not form an editorial opinion or take sides, we give a simpler and wider view of news that already exists. If information in a source we used was inaccurate, distorted, or later disputed but had already entered our analysis, Hunch accepts no liability for that. Predictions are not advice. Phase 1 markets use Hunch Points, not money.
Published by Hunch under the Editorial Code. Complaints and corrections: /contact/.